Wednesday, December 14, 2016

Running Code Analysis and StyleCop on build

If you are programming in .Net best choice is to follow .Net coding standard which MS uses internally. This coding standard is documented in a book Framework Design Guidelines: Conventions, Idioms, and Patterns for Reusable .NET Libraries and later also on MSDN. Event better news is there are 2 tools that implement this standard:
  • StyleCop - checks source code files
  • Code Analysis (ex FxCop, now integrated in VS) - checks compiled code
Below are detailed steps on how to configure these tools so they run on solution build.

Solution StyleCop configuration

In order to define Style Cop for project first solution must have StyleCop rule settings and StyleCop executable files.

Below are the rules I disable from default rule set in StyleCop:
  • Documentation rules
    • SA 1600 – Elements must be documented
    • SA 1633 – File must have header
    • SA 1634 – File header must show copyright
    • SA 1635 – File header must have copyright text
    • SA 1637 – File header must contain file name
    • SA 1638 – File Header file name documentation must match file name
    • SA 1640 – File header must have valid Company text
  • Ordering rules
    • SA 1200 - Using directives must be placed within namespace
  • Spacing rules
    • SA 1027 – Tabs must not be used

Solution Code Analysis configuration

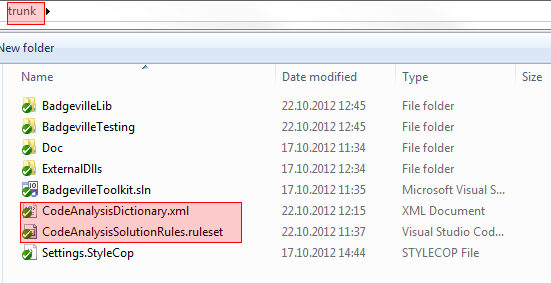
Add Code analysis rule set and dictionary to solution root.
I use recommended rule set is “Microsoft All Rules” without rules:
  • CA2210 Assemblies should have valid strong names (Design)
  • CA1062: Validate arguments of public methods (Design)
  • CA1303: Do not pass literals as localized parameters (Globalization)
  • CA2233: Operations should not overflow (Usage)
  • CA2204: Literals should be spelled correctly (Naming) – useful but it doesn’t work correctly.
See more about Code Analysis Dictionary.

Project manual configuration

To integrate Code Analysis Dictionary and StyleCop in build, unload and edit project and add following tags. Note that paths might be different depending on Solution configuration.
<ItemGroup>
    <CodeAnalysisDictionary Include="$(SolutionDir)\CodeAnalysisDictionary.xml" />
</ItemGroup>

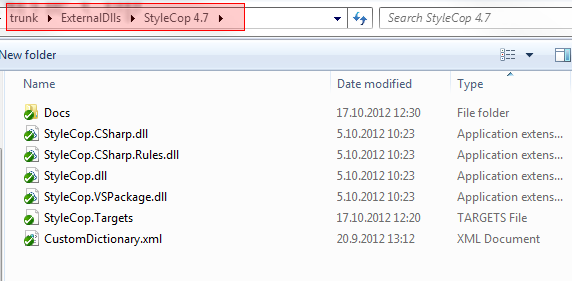
<Import Project="$(SolutionDir)\ExternalDlls\StyleCop 4.7\StyleCop.targets" />

Project build configuration

Configure compiler warning level on Project properties to 4 (most strict).
Check XML documentation files (unless it’s a test project and not documentation is needed because tests are self-documented).

Project Code Analysis configuration

Configure project Debug configuration to use Code Analysis rules in Solution root. Do the same for the Release configuration. Only difference is that in debug mode Code Analysis should not be run because it slows down the build. We keep CA running in Release to get error report from continues integration and to allow easily turning CA on by altering solution mode from Debug to Release.

Saturday, December 10, 2016

c# image control (web app)


  • zoom(+/-)
  • auto play
  • prev
  • next
  • original size
  • fit to size
  • rotate(left/right)
  • flip horizontal
  • flip vertical
  • invert color

Tuesday, November 29, 2016

Structured Code Reviews and Code Quality

The practices:
  • Introducing a continuous delivery pipeline – All systems have gated builds (We use TFS here) so every check in gets built, the tests executed and MSI’s generated. If the build fails for any reason, i.e. compiler error or failing test then the code fails to check in.
  • Enforcing Unit Testing Discipline – All developers now routinely write unit tests for their code. This was an uphill battle, but we are very close to winning that one. We monitor build over time reports in TFS which give a color coded clue to test coverage. We encourage developers to be around 70-75% covered on new code and code they are maintaining.
  • Use of standard Visual Studio Code Metrics – We encourage developers to keep an eye on certain metrics like Cyclomatic Code Complexity and Maintainability indexes. This gives a good high level indicator of any code smells brewing. These metrics are aimed at helping the developer to keep their code readable by reducing complexity.
  • Static Code Analysis – All new code and a lot of legacy systems have static code analysis rules enforced on local and TFS server builds. For new projects we have a custom rule set that is a subset of the ‘Microsoft All Rules’ set. This caused a lot of heated debate in the teams when we started enforcing this, but once people got used to the rules, they just got used to working with it. For old legacy systems we start off applying the ‘Microsoft Minimum Rule’ and then work our way up from there.
  • Code Productivity Tools – We make all our developers use a code productivity tool. We settled on CodeRush as it has a lot of extra tools for guiding less experienced developers, but tools like ReSharper and Telerik Just Code are just as good. The things I like about these tools are the visual on screen feedback they give you. You can enable a colored bar at the side of the code window that informs you of any code issues. These issues are driven from a rule set, so if you get the team into the mind set of getting rid of the color blips whilst they are working (the tool even does most of the work for you) then you are on the road to better code. Generally the refactoring helpers provided by these tools are better than those provided in Visual Studio too.
I won’t pretend that we now churn out systems so beautiful that angels will weep tears of joy, but by enforcing these points we are driving up the code quality standards and the difference have been very noticeable.
I have also started using these tools to guide code reviews. Code reviews used to just be a bunch of developers sitting around the projector picking holes in code. These code reviews were not very effective. Instead I propose the following process for running a code review:
  • Get the code out of source control fresh.
    • Does it build? Yes then continue, No then stop the code review.
  • Run the unit tests.
    • Do they run and all pass? Yes then continue, No then stop the code review.
  •  Check the unit test code coverage.
    • Is the coverage around >60%? Yes then continue, No then stop the code review unless there is a good excuse for the coverage that the review team are happy with.
  •  Check the code metrics (Cyclomatic Complexity and Maintainability Index)
    • Are the metrics within agreed boundaries? Yes then continue, No then stop the code review.
  •  Run the static code analysis against the agreed rule set?
    • Are there any warnings / errors? Yes then stop the code review, No then continue.
  • Once you get to this point, the development practices have been followed and you can proceed to review the actual code.

Unit Test Coverage, Code Metrics, and Static Code Analysis


The basic process was as follows:
  • Get the code out of source control fresh.
    • Does it build? Yes then continue, No then stop the code review.
  • Run the unit tests.
    • Do they run and all pass? Yes then continue, No then stop the code review.
  •  Check the unit test code coverage.
    • Is the coverage around >60%? Yes then continue, No then stop the code review unless there is a good excuse for the coverage that the review team are happy with.
  •  Check the code metrics (Cyclomatic Complexity and Maintainability Index)
    • Are the metrics within agreed boundaries? Yes then continue, No then stop the code review.
  •  Run the static code analysis against the agreed rule set?
    • Are there any warnings / errors? Yes then stop the code review, No then continue.
  • Once you get to this point, the development practices have been followed and you can proceed to review the actual code.
Unit Test Coverage
Whilst you are developing your software you should be writing tests to exercise that code. Whether you practice test driven development and write your tests first or write tests after the fact, you need a decent level of test coverage. This gives you a level of confidence that the code you are writing does what you expect it too. Also, it gives you a safety blanket when you need to refactor your code. If you make a change in one area, does it break something somewhere else? Unit tests should give you that answer.
The screen shot below, shows the Test Explorer view in Visual Studio 2012. From this view you can run all of your unit tests. As of Visual Studio 2012 Update 1, you can group you tests based on pass outcome, length of execution and project. Think of this view as your project health dashboard. If you have a good level of coverage and they are all green, then you can carry on developing. If you have any red tests then you need to work out why and fix them. Don’t let this view lead you into a false sense of security though. You still need to write tests to a decent level of coverage and ensure you are testing the right things.
Visual Studio 2012 - Test Explorer
Visual Studio 2012 – Test Explorer
You can check your test coverage very easily in Visual Studio. First you can click the little drop down ‘Run’ menu in the Test Explorer, or you can open the ‘Test’ menu in Visual Studio, and then open up the ‘Analyse Test Coverage’ and select ‘All Tests’. This will give you a view similar to below.
Visual Studio 2012 - Code Coverage
Visual Studio 2012 – Code Coverage
In the screen shot above you can see that the project overall has a coverage of 73%. This is a good number. It really is not worth chasing 100% as you end up testing things that just don’t need to be tests, but 60 – 70% is a much more realistic goal. In the example above you can see each assembly in the project where you can drill down into more detail to look at class and method coverage. The key metric here is the ‘Covered % Blocks’ column on the right. It makes sense to routinely check this view so you can keep an eye on your overall coverage. If anything creeps below 60%, then you can take a look. Sometimes you may feel that the area in question doesn’t need extra tests, but you can only make that call when you see the stats in front of your eyes. Purists will argue you need to cover every last inch of code in tests, but we live in the real world and need to be more pragmatic about it.
If you do have any area of code where test coverage has slipped, then Visual Studio makes it very easy to find these areas.
Visual Studio 2012 - Code Coverage Button
Visual Studio 2012 – Code Coverage Button
In the code coverage window, click the highlighted button above (Show Code Coverage Coloring), and then double click on a method that has low coverage, you will be taken to the source code file and any uncovered blocks will be highlighted in red. In the example below, there are 3 items that are uncovered. The first and third examples are where an exception is being thrown based on a null argument check; I would add tests in for those. The middle example just has a public property returning a string. In my view there is no point adding a test for this as you are just testing that the language works at that point.
Visual Studio 2012 - Uncovered Code
Visual Studio 2012 – Uncovered Code
Code Metrics
Unit test coverage is only one part of determining the health of your code base. You can have high test coverage and still have code that is tangled, hard to read and maintain. Visual Studio provides tools to help you, at a glance, look for smells with the structure of your code. To access this view, open the ‘Analyse’ menu in visual studio and select ‘Calculate Code Metrics for Solution’. This will give you a view like below.
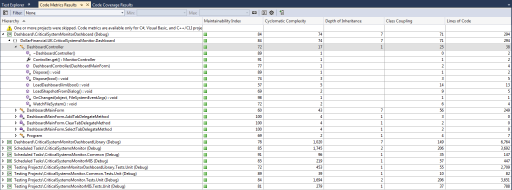
Visual Studio 2012 - Code Metrics
Visual Studio 2012 – Code Metrics

Maintainability Index
Cyclomatic Complexity
Class Coupling
Depth of Inheritance
Green
> 60
< 10
< 20
< 5
Yellow
40 - 60
10 - 15


Red
< 40
> 15
> 20
The metrics shown in the columns are:
Maintainablity Index: The Maintainability Index calculates an index value between 0 and 100 that represents the relative ease of maintaining the code. A high value means better maintainability. Color coded ratings can be used to quickly identify trouble spots in your code. A green rating is between 20 and 100 and indicates that the code has good maintainability. A yellow rating is between 10 and 19 and indicates that the code is moderately maintainable. A red rating is a rating between 0 and 9 and indicates low maintainability.
Cyclomatic Complexity: Cyclomatic complexity (or conditional complexity) is a software measurement metric that is used to indicate the complexity of a program. It directly measures the number of linearly independent paths through a program’s source code. Cyclomatic complexity may also be applied to individual functions, modules, methods or classes within a program. A higher number is bad. I generally direct my team to keep this value below 7. If the number creeps up higher it means your method is starting to get complex and could do with re-factoring  generally by extracting code into separate, well named methods. This will also increase the readability of your code.
Depth of Inheritance: Depth of inheritance, also called depth of inheritance tree (DIT), is defined as “the maximum length from the node to the root of the tree”. A low number for depth implies less complexity but also the possibility of less code reuse through inheritance. High values for DIT mean the potential for errors is also high, low values reduce the potential for errors. High values for DIT indicate a greater potential for code reuse through inheritance, low values suggest less code reuse though inheritance to leverage. Due to lack of sufficient data, there is no currently accepted standard for DIT values. I find keeping this value below 5 is a good measure.
Class Coupling: Class coupling is a measure of how many classes a single class uses. A high number is bad and a low number is generally good with this metric. Class coupling has been shown to be an accurate predictor of software failure and recent studies have shown that an upper-limit value of 9 is the most efficient.
Lines of Code (LOC): Indicates the approximate number of lines in the code. The count is based on the IL code and is therefore not the exact number of lines in the source code file. A very high count might indicate that a type or method is trying to do too much work and should be split up. It might also indicate that the type or method might be hard to maintain.
Based on the metric descriptions above, you can use the code metrics view to drill down into your code and get a very quick view of areas in your code that start to break these guidelines. You can very quickly start to highlight smells in your code and responds to them sooner rather than later. I routinely stop coding and spend 30 minutes or so going through my code metrics to see if I have gone astray. These metrics will help to keep your code honest.
Static Code Analysis
The final code quality tool I want to discuss is that of static code analysis. This has been around for Visual Studio for quite a while now, and used to be called FXCop, but this is now directly integrated into visual studio. Static code analysis runs a set of rules over your code to look for common pitfalls and problems that arise from day to day development. You can change the rule set to turn on/off rules that are relevant to you. You can also change the sensitivity of the rule. For example do you want it to produce a compiler warning, or actually break the build?
If you have a large code base and are thinking of introducing static code analysis, I recommend starting off setting the ‘Microsoft Managed Minimum Rule set’ and getting all those passing first. If you try to jump straight into the ‘Microsoft All Rules’ rules set you will quickly become swamped and then most likely turn off the code analysis.
Adding code analysis to your solution is easy. It is managed at the project level. Right click on the project in the solution explorer and select ‘Properties’. When the properties window appears, select the ‘Code Analysis’ tab as in the screen shot below.
Visual Studio 2012 - Setting Up Code Analysis
Visual Studio 2012 – Setting Up Code Analysis
First you should select the ‘Enable Code Analysis on Build’ check box. This will make sure the rules are run every time you build your code. This forces you to see the issues with your code every time you build instead of relying on yourself to manually check.
In the drop down box you can select which rule set to use. Generally the rule sets provided by Microsoft are enough to work with. What we found was that some rules were not as relevant to us, so I created a custom rules set. You can see where I selected this above. The rule set is called ‘DFGUK2012’.
You can add your own rule set easily. In your solution, right click and select  ‘Add New Item’. When the dialog box appears, select ‘Code Analysis Rule Set’, as shown below.
Visual Studio 2012 - Adding a Custom Rule Set
Visual Studio 2012 – Adding a Custom Rule Set
Then in your ‘project properties’ rule set drop down box, instead of selecting one of the Microsoft rule sets, select ‘<Browse>’, and then browse to your custom rule set. If you double click on the rule set added to your solution, you will be shown the rule set editor, as shown below.
Visual Studio 2012 - Configuring Code Analysis
Visual Studio 2012 – Configuring Code Analysis
From here you can enable/disable rules to suit your project and team. You can also select whether you want a broken rule to show as a compiler warning or error.
Sunday, November 27, 2016

Visual studio IDE startup issue(More time taken to open IDE)

Issue: 

Visual studio IDE startup issue(More time taken to open IDE).

Visual Studio 2015 extremely slow.


Solution:


1) Go to Tools > Options > Source Control and set Current source control … : None
2) Go to Tools > Options > Environment > Synchronized Settings and remove this option by unchecking the checkbox.
3) Clean the following cache folders and restart Visual Studio:
  • Clean the WebSiteCache folder (might be inC:\Users\%USERNAME%\AppData\Local\Microsoft\WebSiteCache)
  • Clean the Temporary ASP.NET Files folder (might be inC:\Users\%USERNAME%\AppData\Local\Temp\Temporary ASP.NET Files)

Friday, November 25, 2016

Coded UI tests

Unit tests typically work by calling methods in the interface of the code under test. However, if you have developed a user interface, a complete test must include pressing the buttons and verifying that the appropriate windows and content appear. Coded UI tests (CUITs) are automated tests that exercise the user interface. See the MSDN topic Testing the User Interface with Automated Coded UI Tests.
How to create and use coded UI tests
Create a coded UI test
To create a coded UI test, you have to create a Coded UI Test Project. In the New Project dialog, you’ll find it under either Visual Basic\Test or Visual C#\Test. If you already have a Coded UI Test project, add to it a new Coded UI Test.
In the Generate Code dialog, choose Record Actions. Visual Studio is minimized and the Coded UI Test builder appears at the bottom right of your screen.
Choose the Record button, and start the application you want to test.
Recording a coded UI test
Perform a series of actions that you want to test. You can edit them later. You can also use the Target button to create assertions about the states of the UI elements. The Generate Code button turns your sequence of actions into unit test code. This is where you can edit the sequence as much as you like. For example, you can delete anything you did accidentally.
Running coded UI tests
Coded UI tests run along with your other unit tests in exactly the same way. When you check in your source code, you should check in coded UI tests along with other unit tests, and they will run as part of your build verification tests.
Tip: Keep your fingers off the keyboard and mouse while a CUIT is playing. Sitting on your hands helps.
Edit and add assertions
Your actions have been turned into a series of statements. When you run this test, your actions will be replayed in simulation.
What’s missing at this stage is assertions. But you can now add code to test the states of UI elements. You can use the Target button to create proxy objects that represent UI elements that you choose. Then you write code that uses the public methods of those objects to test the element’s state. Extend the basic procedure to use multiple values You can edit the code so that the procedure you recorded will run repeatedly with different input values. In the simplest case, you simply edit the code to insert a loop, and write a series of values into the code.
But you can also link the test to a separate table of values, which you can supply in a spreadsheet, XML file, or database. In a spreadsheet, for example, you provide a table in which each row is a set of data for each iteration of the loop. In each column, you provide values for a particular variable. The first row is a header in which the data names are identified:
Flavor                     Size
Oatmeal                   Small
Herring                    Large
In the Properties of the coded UI test, create a new Data Connection String. The connection string wizard lets you choose your source of data. Within the code, you can then write statements such as
C#
var flavor = TestContext.DataRow[“Flavor”].ToString();
Isolate
As with any unit tests, you can isolate the component or layer that you are testing—in this case, the user interface—by providing a fake business layer. This layer should simply log the calls and be able to change states so that your assertions can verify that the user interface passed the correct calls and displayed the state correctly.
Test first?
You might think this isn’t one of those cases where you can realistically write the tests before you write the code. After all, you have to create the user interface before you can record actions in the Coded UI Test Builder.
This is true to a certain extent, especially if the user interface responds quite dynamically to the state of the business logic. But nevertheless, you’ll often find that you can record some actions on buttons that don’t do much during your recording, and then write some assertions that will only work when the business logic is coupled up.
Coded UI tests: are they unit or system tests?
Coded UI tests are a very effective way of quickly writing a test. Strictly speaking, they are intended for two purposes: testing the UI by itself in isolation (with the business logic faked); and system testing your whole application.
But coded UI tests are such a fast way of creating tests that it’s tempting to stretch their scope a bit. For example, suppose you’re writing a little desktop application—maybe it accesses a database or the web. The business logic is driven directly from the user interface. Clearly, a quick way of creating tests for the business logic is to record coded UI tests for all the main features, while faking out external sources of variation such as the web or the database. And you might decide that your time is better spent doing that than writing the code for the business logic.
Cover your ears for a moment against the screams of the methodology consultants. What’s agonizing them is that if you were to test the business logic by clicking the buttons of the UI, you would be coupling the UI to the business logic and undoing all the good software engineering that kept them separate. If you were to change your UI, they argue, you would lose the unit tests of your business logic.
Furthermore, since coded UI tests can only realistically be created after the application is running, following this approach wouldn’t allow you to follow the test-first strategy, which is very good for focusing your ideas and discussions about what the code should do.
For these reasons, we don’t really recommend using coded UI tests as a substitute for proper unit tests of the business logic. We recommend thinking of the business logic as being driven by an API (that you could drive from another code component), and the UI as just one way of calling the operations of the API. And to write an API, it’s a good idea to start by writing samples of calling sequences, which become some of your test methods.
But it’s your call; if you’re confident that your app is short-lived, small, and insignificant, then coded UI tests can be a great way to write some quick tests.

SQL Server In-Memory OLTP

1. Introduction

In-Memory OLTP, also known as ‘Hekaton’ and ‘In-Memory Optimization’, is Microsoft’s latest in-memory processing technology. In-Memory OLTP is optimized for Online Transaction Processing (OLTP). It is integrated into SQL Server’s Database Engine and can be used in the exact same manner as any other Database Engine component.
In-Memory OLTP originally shipped with SQL Server 2014 and it mainly features two new data structures which are Memory-Optimized Tables, and Natively-Compiled Stored Procedures.

Memory-optimized tables

Memory-optimized tables store their data into memory using multiple versions of each row’s data. This technique is characterized as ‘non-blocking multi-version optimistic concurrency control’ and eliminates both locks and latches, thereby achieving significant performance advantages.
The main features of memory-optimized tables are:
  • Rows in the table are read from, and written to, memory
  • The entire table resides in memory
  • Non-blocking multi-version optimistic concurrency control
  • The option of durable & non-durable data
  • A second copy is maintained on disk for durability (if enabled)
  • Data in memory-optimized tables is only read from disk during database recovery
  • It is interoperable with disk-based tables

Natively-compiled stored procedures

A natively-compiled stored procedure is a SQL Server object that can access only memory-optimized data structures such as memory-optimized tables, table variables, etc. The main features of a natively-compiled stored procedure are:
  • It is compiled to native code (DLL) upon its creation (the interpreted stored procedures are compiled at first execution)
  • Aggressive optimizations take time at compile time
  • It can only interact with memory-optimized tables
  • The call to a natively-compiled stored procedure is actually a call to its DLL entry point

2. Best-Suited Workloads

I’ve already mentioned that In-Memory OLTP in SQL Server is optimized for OLTP processing. This means that it performs best for certain specific types of workload. It does not mean, however, that if it is used against other types of workload it won’t perform well; but there is a recommendation from Microsoft which specifies the main workload areas that are most likely to see the greatest benefits from using In-Memory OLTP. This can help you identify if you have a workload that can be potentially optimized using SQL Server’s In-Memory Optimization.
The below table summarizes these workload types.
Workload Type
Examples
Main Benefits of In-Memory OLTP
High Data Insert Rate
  • Smart Metering
  • System Telemetry
  • eliminate contention
  • minimize i/o logging
Read Performance and Scale
Social Network Browsing
  • Eliminate contention
  • Efficient data retrieval
  • Minimize code execution time
  • CPU efficiency for scale
Compute Heavy Data Processing
Manufacturing supply chains or retailers
  • Eliminate contention
  • Minimize code execution time
  • Efficient data processing
Low Latency
  • Online Gaming Platforms
  • Capital Markets
  • Eliminate contention
  • Minimize code execution time
  • Efficient data retrieval
Session State Management
Managing sessions (i.e. user requests, etc.) for a heavily-visited websites
  • Eliminate contention
  • Efficient data retrieval
  • Optional I/O reduction/removal
Table1: Best-Suited Workload Types for In-Memory OLTP.

3. Memory-Optimized Tables

Memory-optimized tables are by default durable, meaning that in case of a server crash or failover the

data will be recovered from the transaction logs. However, you can also define a memory-optimized table as non-durable. That means that transactions on these tables do not require any disk I/O, however in the case of server crash or failover, the data in these tables will not be recovered because the memory buffers will be flashed.
The decision to use durable or non-durable memory-optimized tables depends on the business requirements. For example, if you want to use a memory-optimized table as part of data warehouse staging process where it gets deleted every day and re-populated with millions of records in order to perform computations and pass the results to other tables, then it would not be a bad idea to use a non-durable memory-optimized table. If however you have a table with permanent data that gets updated daily and you decide to migrate it to a memory-optimized table then you should consider using a durable table memory-optimized table.
Let’s see how a disk-based table can be defined/migrated as a memory-optimized table in SQL Server. For example consider a table named “Product” with the following definition
Listing 1: The Disk-Based Table “Product”.
The corresponding non-durable memory-optimized table for “Product” would be defined as below:
Listing 2: The Memory-Optimized Non-Durable Table “Product”.
The Durability setting for the above table is set to “SCHEMA_ONLY” meaning that only the schema of the table will be recovered in the case of a server crash or failover.
Also, the corresponding durable memory-optimized table for “Product” would be defined as below, having as the only difference from the previous one the value “SCHEMA_AND_DATA” for the Durability setting:
Listing 3: The Memory-Optimized Durable Table “Product”.
As well as the “Durability” setting in the memory-optimized table definitions, you also need to take non-clustered indexes into consideration. Memory-optimized tables do not support clustered indexes but do however support non-clustered indexes (currently up to eight). Along with each index specification you will also need to specify the BUCKET_COUNT value. The recommended value for this, is to be between 1.5 and 2 times the estimated number of unique values (500 unique products in this example) for the column indexed by the non-clustered index. If you estimate that you are going to have large tables (i.e. with over 5 million unique values or more), then for saving up memory consumption you can set the Bucket_Count value to 1.5 times the number of unique values. In the opposite case you can set the Bucket_Count value to 2 times the number of unique values.
In SQL Server 2014, there is was a restriction on memory-optimized tables that requires that every string column that participates in a non-clustered index must have a *_BIN2 collation. Either you need to have the default collation set as *_BIN2 or should explicitly specify a *_BIN2 collation for the column that will participate in the index. An example is shown below:
Listing 4: Specifying a *_BIN2 Collation for the Memory-Optimized Table “Product”.
In SQL Server 2016 In-Memory OLTP, these limitations do not exist as there is full support for all collations.

4. Natively-Compiled Stored-Procedures

Natively-compiled stored procedures can only be used for processing memory-optimized tables, as well as other T-SQL constructs that are supported such as subqueries, scalar user-defined functions, built-in math functions, etc. They are compiled to native code and execute without the need for any further compilation or interpretation.
Based on the previous examples, the listing below has the definition of a natively-compiled stored procedure that updates the “Price” column of the memory-optimized table “Product”.
Listing 5: The Natively-Compiled Stored Procedure for Updating the Table “Product”.
Some points to note in the above definition of the natively-compiled stored procedure are:
  • The WITH NATIVE_COMPILATION clause is used
  • The SCHMABINDING clause is required because it bounds the stored procedure to the schema of the objects it references
  • The BEGIN_ATOMIC clause is required because the stored procedure must consist of exactly one block along with the Transaction Isolation Level.

5. Limitations

In-Memory OLTP had certain limitations when originally shipped with SQL Server 2014. Examples of such limitations are: not being able to create Indexes on NULLable columns or use OUTER JOIN, UNION, DISTINCT etc. However, in SQL Server 2016 we see that many of these limitations are lifted.
The below table compares the main limitations and features of In-Memory OLTP in SQL Server 2014 in comparison to SQL Server 2016 (CTP 2).
Feature / Limitation
SQL Server 2014
SQL Server 2016 CTP2
Maximum memory for memory-optimized tables
Recommendation (not hard limit): 256 GB
Recommendation (not hard limit): 2TB
Collation support
Must use a *_BIN2 collation for:
(i) Character columns used as all or part of an index key.
(ii) All comparisons/sorting between character values in natively-compiled modules.
Must use Latin code pages for char and varchar columns.
All collations are fully supported
Alter memory-optimized tables (after creation)
Not Supported
Supported
Alter natively-compiled stored procedures
Not Supported
Supported
Parallel plan for operations accessing memory-optimized tables
Not Supported
Supported
Transparent Data Encryption (TDE)
Not Supported
Supported
Use of the below language constructs in natively-compiled stored procedures:
  • LEFT and RIGHT OUTER JOIN
  • SELECT DISTINCT
  • OR and NOT operators
  • Subqueries in all clauses of a SELECT statement
  • Nested stored procedure calls
  • UNION and UNION ALL
  • All built-in math functions
Not Supported
Supported
DML triggers in memory-optimized tables
Not Supported
Supported
(AFTER triggers, natively-compiled)
Multiple Active Result Sets (MARS)
Not Supported
Supported
Large Objects (LOBs):
  • varchar(max)
  • nvarchar(max)
  • varbinary(max)
Not Supported
Supported
Offline Checkpoint Threads
1
Multiple Threads
Natively-compiled, scalar user-defined functions
Not Supported
Supported
Indexes on NULLable columns
Not Supported
Supported
Table2: Comparison of In-Memory OLTP Limitations/Features in SQL Server 2014 vs SQL Server 2016.

6. Conclusions

In this article we discussed about memory-optimized tables and natively-compiled stored procedures which are provided in SQL Server 2014 or later. These new data structures are part of the In-Memory OLTP Engine of SQL Server which can be used in order to achieve significant performance over processing that uses “traditional” disk-based data structures.
We have also discussed about the workload types which can benefit the most in terms of performance when In-Memory OLTP is used. Furthermore, we saw simple examples on how we can define memory-optimized tables and natively-compiled stored procedures. Last, we discussed about the limitations and features of In-Memory OLTP in SQL Server 2014 in comparison to SQL Server 2016 (CTP2).
As we can see, in SQL Server 2016 there is more support for In-Memory OLTP and a more seamless integration with SQL Server’s Database Engine. In-Memory OLTP is here to stay and following the momentum of its predecessor technologies (PowerPivot engine/Vertipaq, In-Memory Columnstore Index) it is something that constantly evolves, aiming at providing a powerful processing engine for intensive database operations.

Encrypt/Decrypt the App.Config

Program.cs using System; using System.Diagnostics; using System.IO; namespace EncryptAppConfig {     internal class Program     {         pr...